I developed a fascination with creative data representation during the lockdowns of 2020/21 and I wrote at length previously about how that brought me to present Gender in the Board rooms of Ireland as a hand-knitted scarf. Part of what I enjoyed was the opportunity to spark a conversation by surprising people with a visual prompt rather than statistics.
It turns out, it’s also rather addictive. When the mental itch returned and I started casting around for a new topic to explore, discussions of the state of the housing market and homelessnes were rife on the airways.
At that point, much of my work with teams and organisations was taking me back to first principles – what are the values that underpin our organisation and what are the behaviours that best express those values in action? I started pondering the same question for our little nation – what are the values we hold dear and how are we doing on the behaviours that best express hem?
One phrase that kept popping into mind was the quote from the declaration of independence about cherishing our children.
Here it is in its entirety:
“The Republic guarantees religious and civil liberty, equal rights and equal opportunities to all its citizens, and declares its resolve to pursue the happiness and prosperity of the whole nation and of all its parts, cherishing all the children of the nation equally.” (emphasis added)1916 Proclamation of Independence
In 2012, almost a century later, we copperfastened this intention into our Constitution by voting in an amendment to Article 42A, which opens with this clause: “The State recognises and affirms the natural and imprescriptible rights of all children and shall, as far as practicable, by its laws protect and vindicate those rights.”
Combining these different strands of thought, I began to think about a representation of child homelessness in the 21st century as a visual testament to how well we’re living that value and cherishing all the children.
I started out with the intention of tracking the data for the first two decades of the 21st century. It turns out I was in good company. At the turn of the century, other minds were interrogating the same question which resulted in our first ever Youth Homelessness Strategy in 2001.
The goal of this Strategy was: “to reduce and if possible eliminate youth homelessness through preventative strategies and where a child becomes homeless to ensure that he/she benefits from a comprehensive range of services aimed at re-integrating him/her into his/her community as quickly as possible.”
Year Homeless Children
| 2014 | 880 |
| 2015 | 1616 |
| 2016 | 2505 |
| 2017 | 3079 |
| 2018 | 3559 |
| 2019 | 3422 |
| 2020 | 2327 |
| 2021 | 2513 |
My first discovery was that he data on child homelessness for the first decade of the century was patchy and inconsistent. It reminded me of the old business adage that “what gets measured, gets managed”. It seems we weren’t really measuring it, let alone managing it! The comprehensive review of the strategy in 2013 similarly reported that there was little consistent data on child homelessness in the first dozen years of the strategy and remedied the situation from that point forward so I have chosen to plot the data from 2014 – 2021, which are the years for which we have consistent, comparable figures (using monthly homelessness figures from the Department of Housing, Local Government and Heritage as published on www.gov.ie). While clear and comparable, the figures don’t make for encouraging reading.
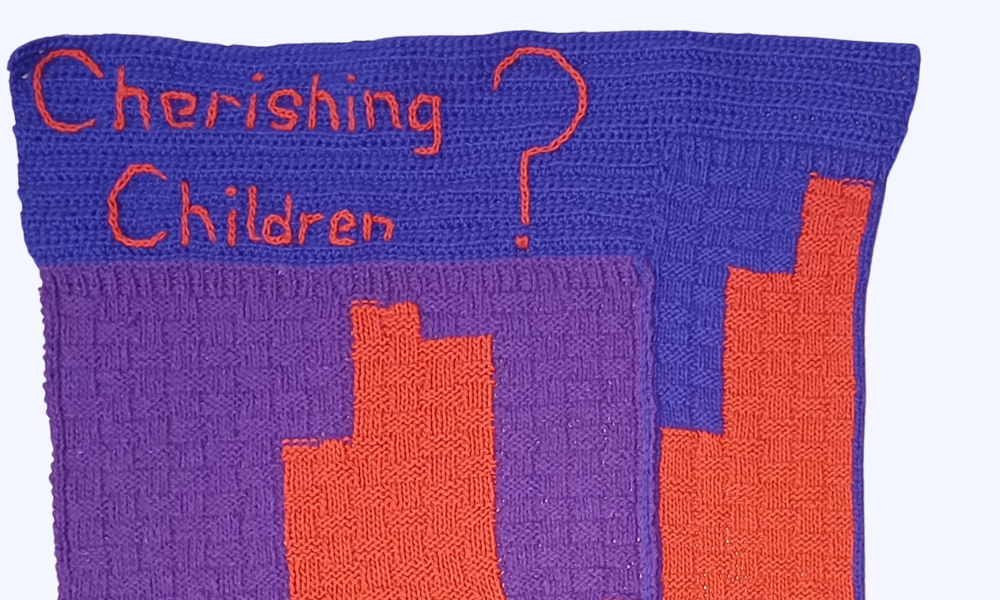
I converted the data into textile by having each stitch represent two children. The numbers were so large, I feared a stitch per child would be unwieldy. In hindsight, I wish I had kept to one stitch per child – this data is unwieldy and we should be made to handle it in all its substantial discomfort.
The timeline is a simple bar chart with two blocks for each year so you’re reading the eight years from 2014 – 2021 from left to right as it’s pictured here.
In theory, this is a warm, comforting purple baby blanket in basket weave (a nod to the traditional Moses basket we nestle our newborns into), interrupted by red where children are without shelter.
In reality, the blanket gets more red as time progresses, not less (despite some drop in the final two years), ending with a figure that is almost triple where we started in 2014 and is a fall from a peak in 2018 when the figure had quadrupled from an already alarming base!
Once again, I’m not sure I’m surprised by the figures but I did find them hard to work with in practice (I quit knitting over the Christmas break as the amount of red yarn felt heart-breaking), which reinforced for me the power of a tangible representation of numbers that I can otherwise file away more easily in my head without feeling them in my body.
I share it, so that it might spark a reaction for you as you read, review and think about this topic too. I offer no easy solution. There are many working hard on solving this issue in different ways and we can each reflect on how to play our part.
I’ll finish by returning to my initial inspiration and invite each and every one of us to reflect on the values we believe we hold dear (in our families, communities and as a Nation) and to do a sense check on how well we are living those out in our everyday actions.