by Carol Conway | Aug 10, 2025
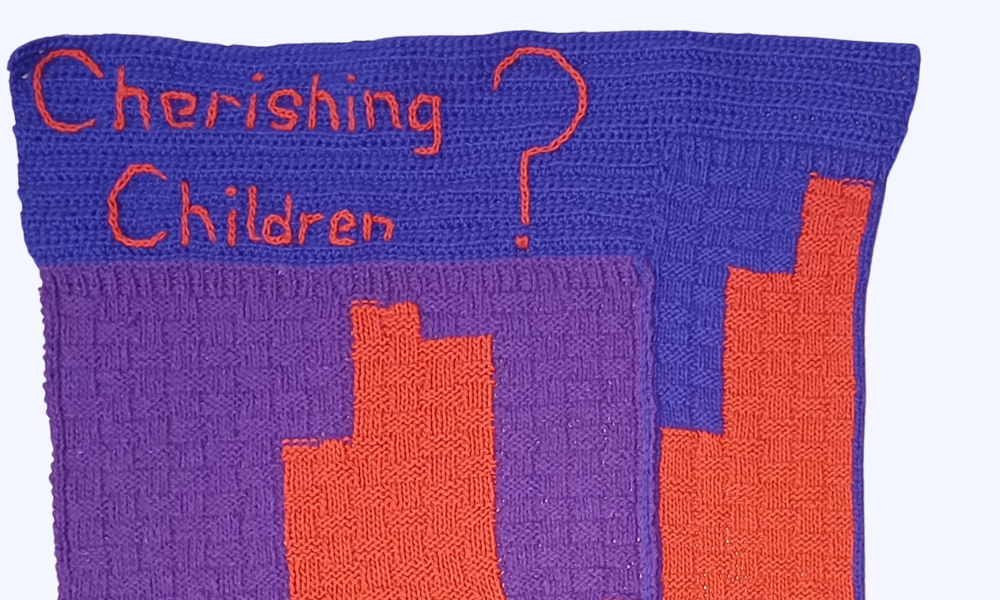
This crafted data visualisation charts a decade of rising child homelessness in Ireland (2014–2024), transforming stark statistics into a baby blanket—purple for safety, red for every homeless child. The piece highlights that what appeared to be progress was merely a...

by Carol Conway | Aug 10, 2025
During lockdown, I channelled my empty mental space into a creative data visualisation project, transforming gender balance statistics from boardrooms into knitted works of art. Inspired by Sue Montgomery’s knitting-as-protest, I began with the Fortune 500,...